AutoBI
Explore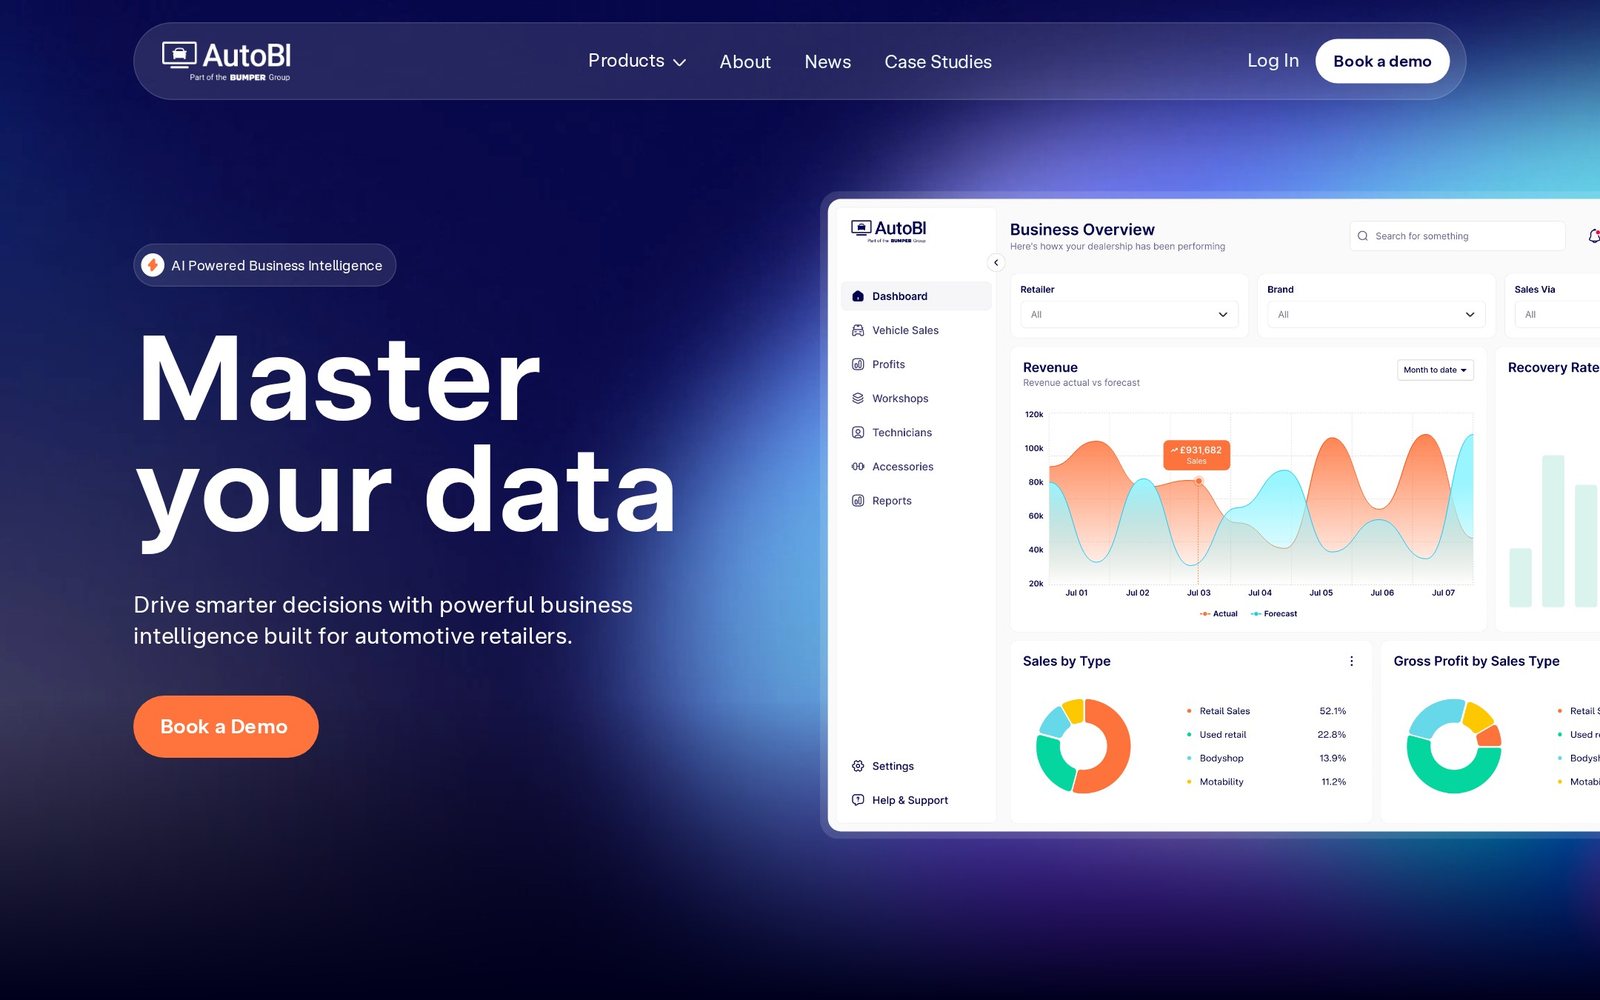
Services
Year
2025
What is AutoBI?
AutoBI is an AI powered business intelligence platform built for automotive retailers and part of the Bumper Group. It pulls sales, workshop, parts and technician data out of dealer management systems into one live dashboard, so groups can see revenue against forecast, gross profit per vehicle and workshop efficiency in real time instead of waiting on month-end spreadsheets.
Key Features
- Business overview dashboard with revenue actual vs forecast and recovery rate
- Vehicle sales analytics split by retail, used retail, bodyshop and Motability
- Gross profit per vehicle, parts margin and profit per unit tracked live
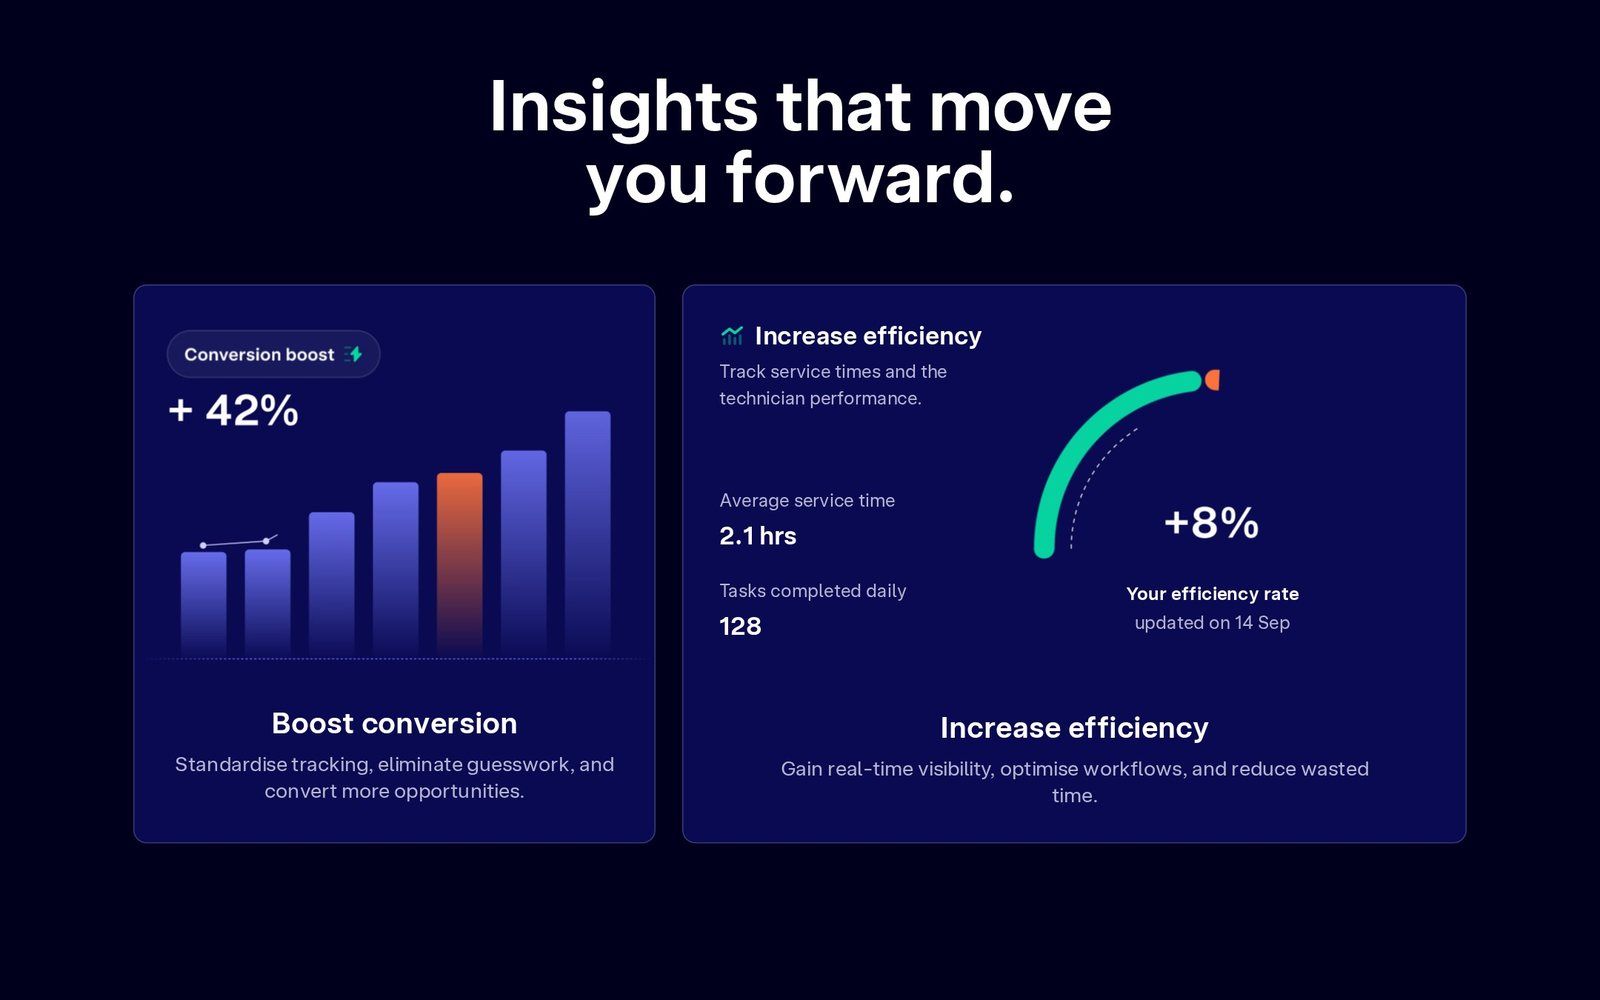
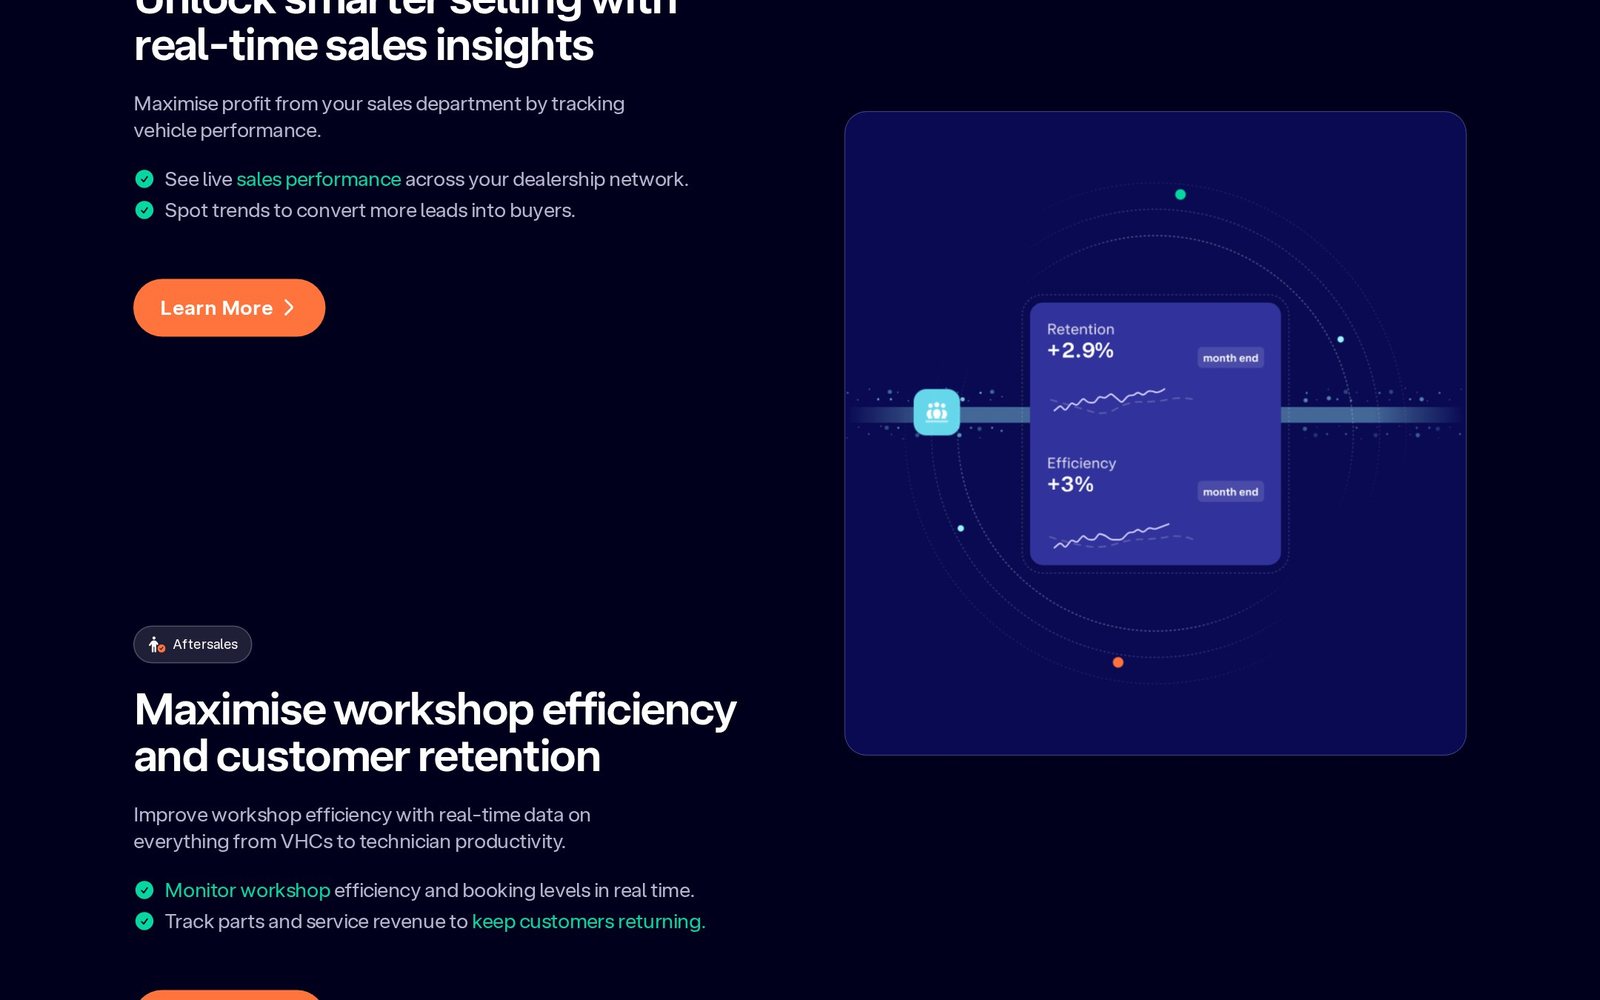
- Workshop efficiency with average service time, technician performance and daily task volume
- Intelligent market price tracking that compares stock against live competitor pricing
- At-risk customer alerts and parts reorder prompts driven by AI
- Retailer, brand and sales-channel filters applied across every report
- Scheduled reports and exports for group, region and single-site management
Technical Highlights
- Built with Next.js and TypeScript for a fast, typed dashboard shell
- Styled with TailwindCSS on a deep navy and orange design system
- Charts, donuts and forecast bands rendered with Recharts and custom SVG
- Nightly and near-real-time ingestion from Keyloop, Pinewood, CitNOW, eDynamix and Quiter feeds
- Warehouse-side aggregation so multi-site groups load reports in under a second
- Virtualised tables and memoised selectors to keep large data grids smooth
- Role-based access for group, region and site level users
- Hosted on Microsoft Azure with encrypted dealer data at rest
The Challenge
Dealer groups already sit on enormous amounts of data, but it is trapped in several disconnected systems — one for vehicle sales, another for the workshop, another for parts — each with its own export format and its own version of the truth. Managers were rebuilding the same spreadsheets every month, and by the time a report was ready the opportunity it described had passed. The challenge was to unify those feeds into one trustworthy model and present it densely enough for a group director while staying readable for a single site manager.
The Solution
We designed a single business overview that answers the first question every retailer asks — how are we performing right now — and lets you drill from group level into brand, retailer and channel without losing context. Revenue actual versus forecast, sales mix, gross profit by type and recovery rate sit above the fold; workshop, technician, parts and pricing modules go deeper. AI layers on top of the same data to flag at-risk customers, suggest reorders and compare stock against live market pricing, so the dashboard recommends an action instead of just reporting a number.
Project Showcase
Related projects
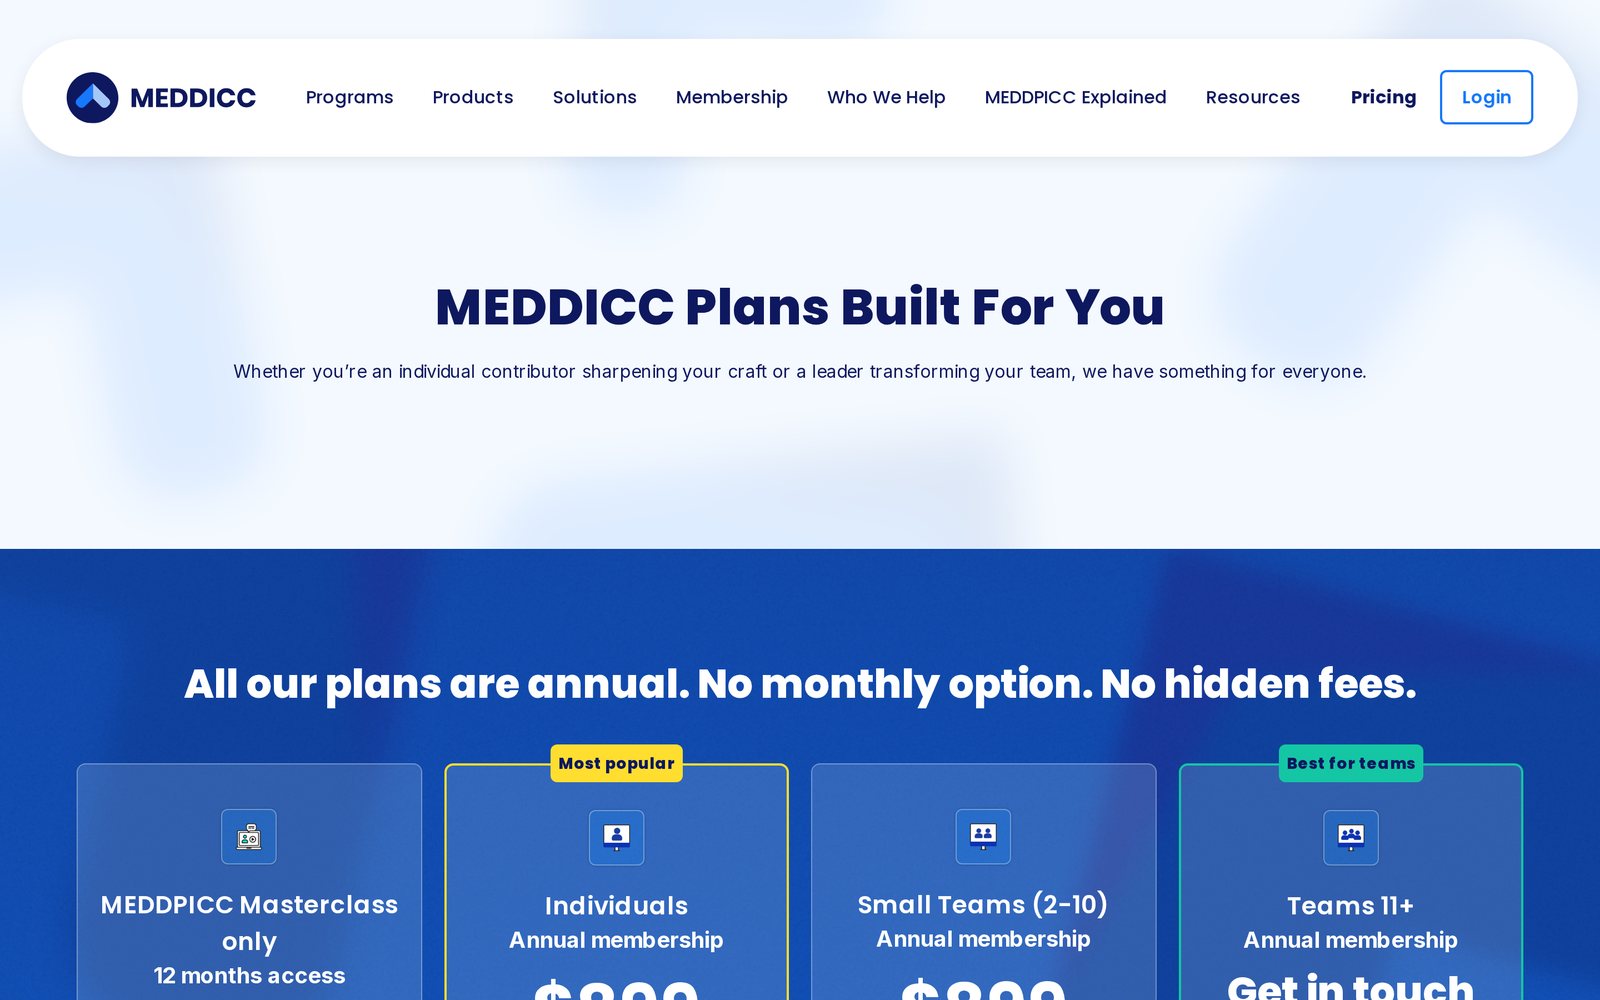
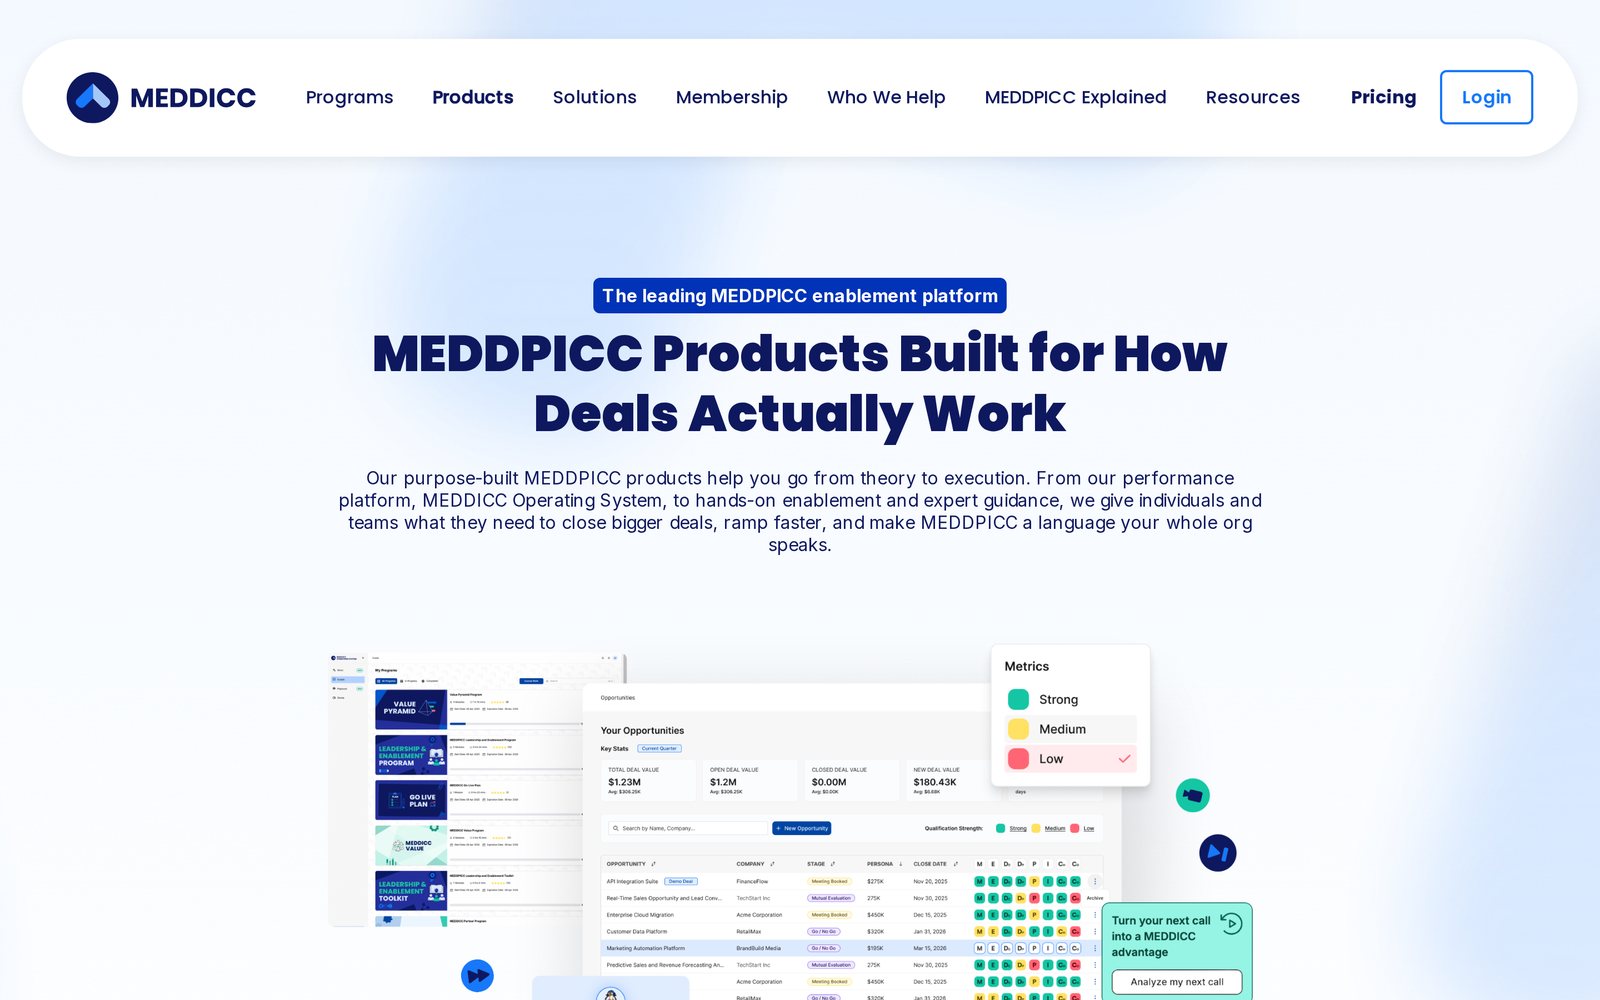
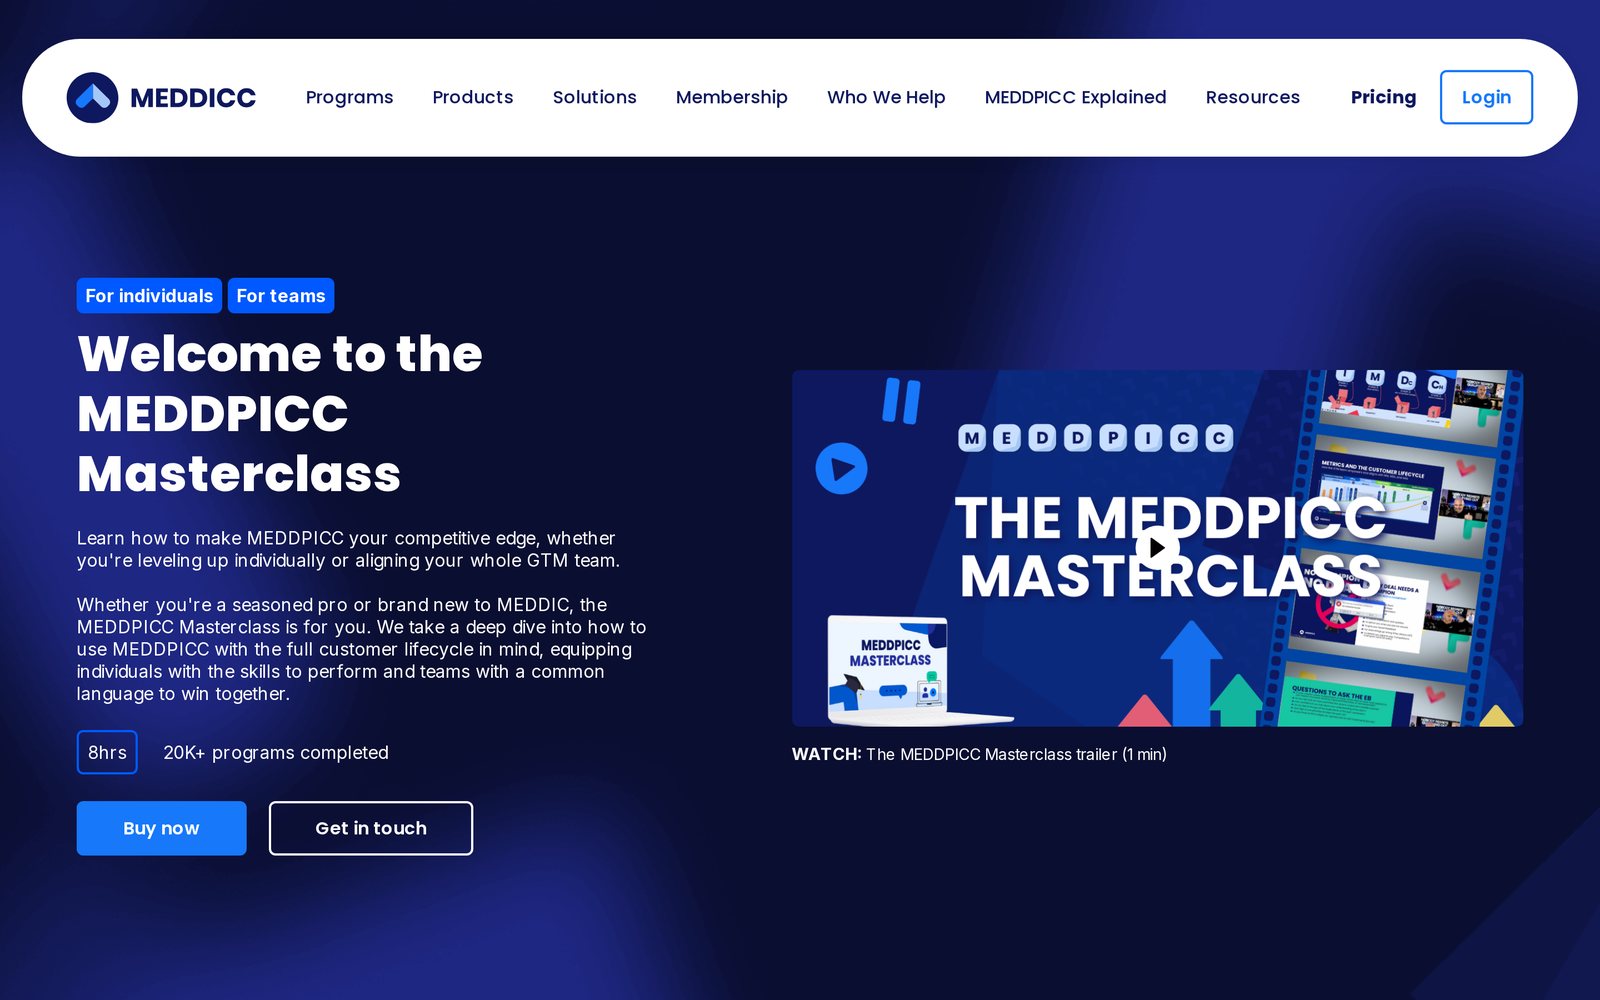
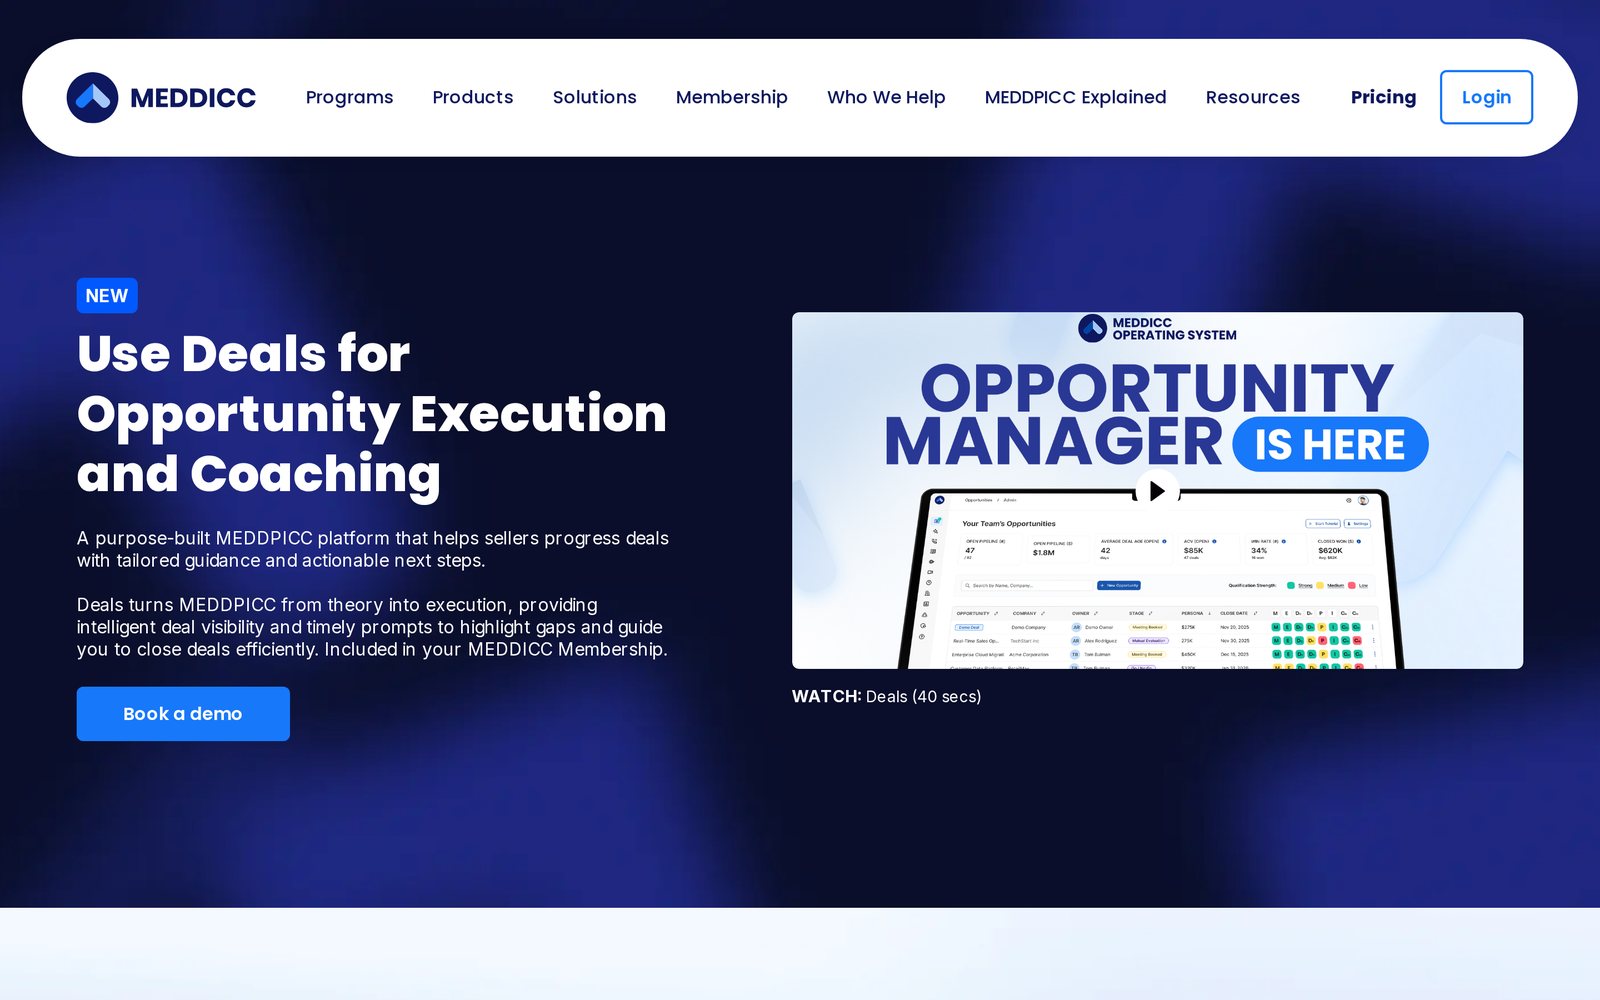
MEDDICC
The performance platform where revenue teams learn MEDDPICC, qualify deals and forecast with confidence — training, tooling and AI in one operating system.
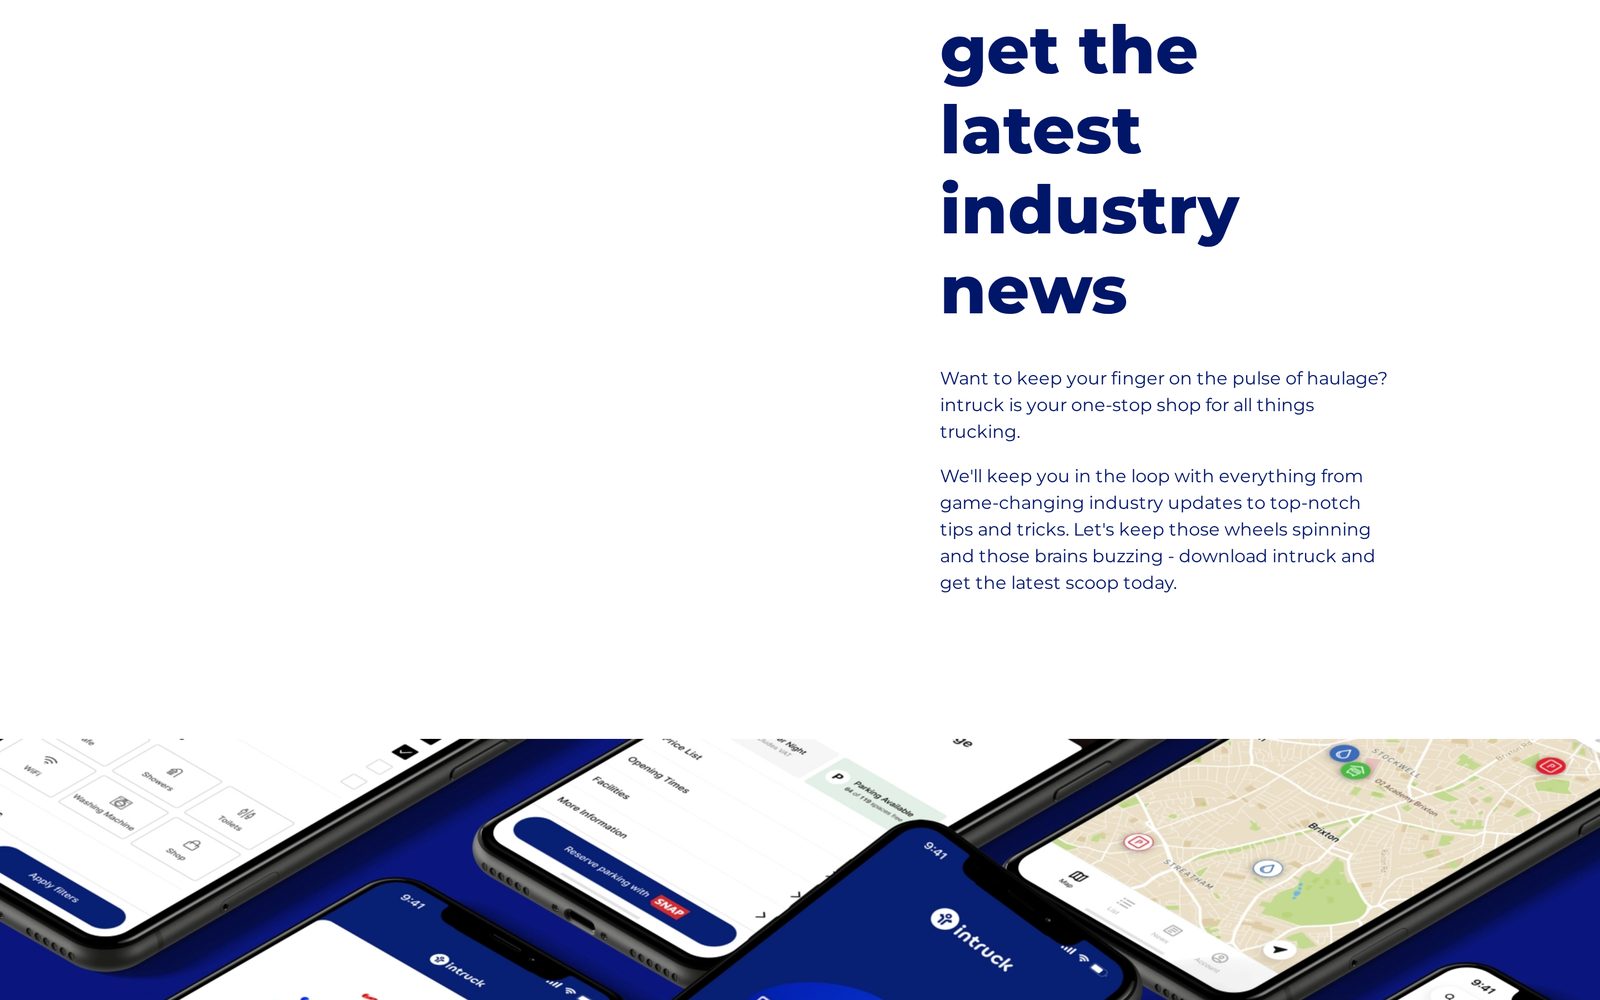
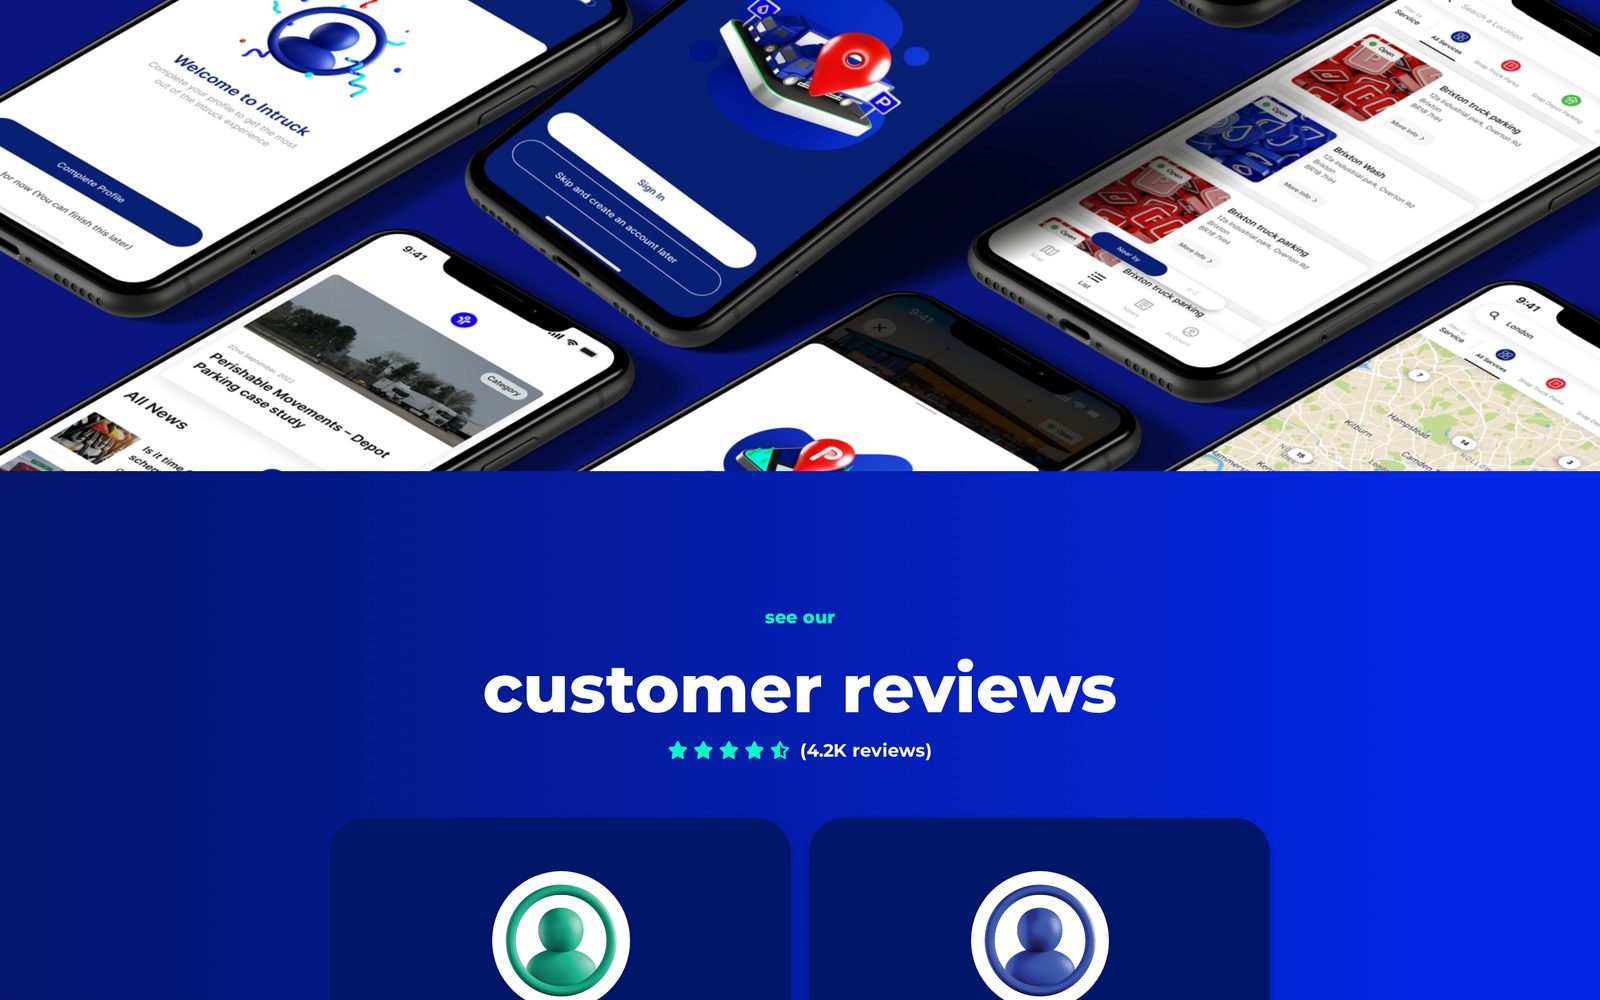
InTruck
A mobile app used by over 100,000 truck drivers to plan journeys, find parking, washing and facilities on the road, and book their stops in a few taps.
Erwin Gepting
A cinematic portfolio website for a Hamburg-based Director of Photography, showcasing visual storytelling through immersive video experiences, advanced scroll animations, and a seamless content management system.